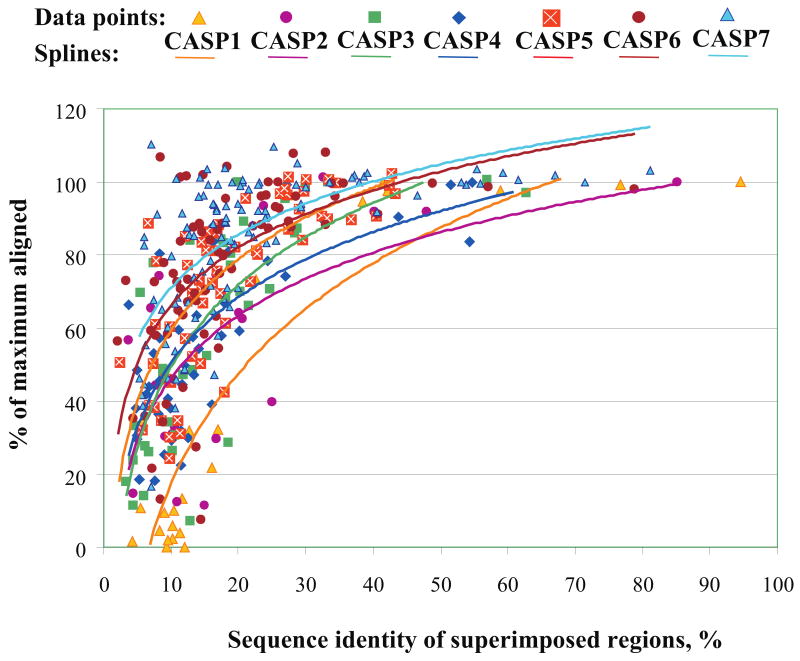
FIGURE 1. Alignment accuracy for the best model of each target in all CASPs as percentage of maximum alignability.
Targets are ordered by sequence identity between the target and the closest template. Values on the vertical axis represent the ratio between the number of residues correctly aligned to the target structure in the best model and the maximum number of residues that can be aligned between the best available template and the target structure. An alignment of 100% indicates that all residues with an equivalent in the template were correctly aligned. A value greater than 100% indicates an improvement in model quality beyond that obtained by copying a template structure. Values above 100% may be obtained by using additional templates, through refinement or with template free methods. Trend lines show a steady though sometimes modest improvement over successive CASPs.

