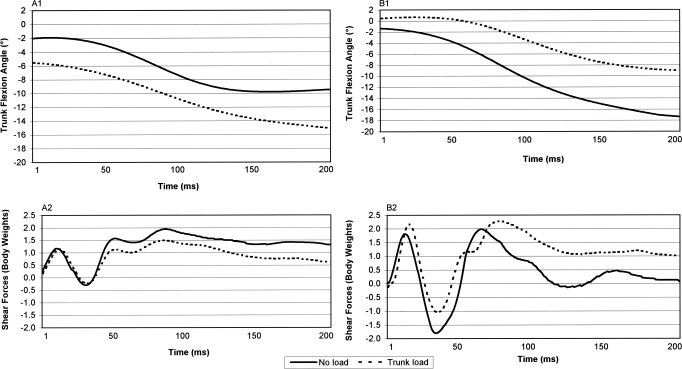
Figure 2.
Representative trunk flexion and shear forces in each trunk adaptation group. Data are presented for A, 1 individual in the trunk flexor adaptation group and B, 1 individual in the trunk extensor group. Positive values represent trunk extension and anterior shear forces. Negative values represent trunk flexion and posterior shear forces. Knee shear forces are normalized to body weight.

