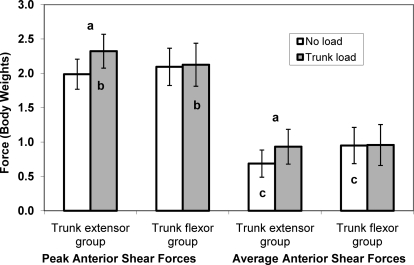
Figure 3.
Peak and average anterior shear forces across conditions and between groups. Vertical bars represent 95% confidence intervals. a Indicates increase across no-load to trunk-load conditions. b Indicates group differences in the trunk-load condition. c Indicates group differences in the no-load condition. a–c Collectively used to explain the condition-by-group interactions for both peak and average variables (both P < .01).

