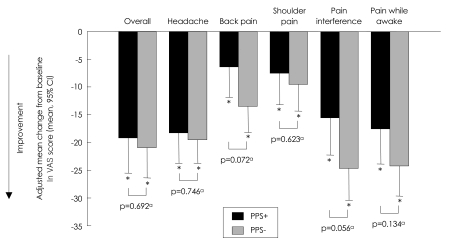
FIGURE 3.
Adjusted mean change from baseline to endpoint in VAS overall and subscales. ap-values for adjusted mean difference using Type III Sums Of Squares from analysis of covariance (ANCOVA) model: change=PPS group, propensity score and baseline. *Within group p-value from ANCOVA model: change=PPS group, propensity score and baseline. PPS+: painful physical symptom positive group, PPS-: remainder of study population, VAS: Visual Analog Scale, CI: confidence interval.

