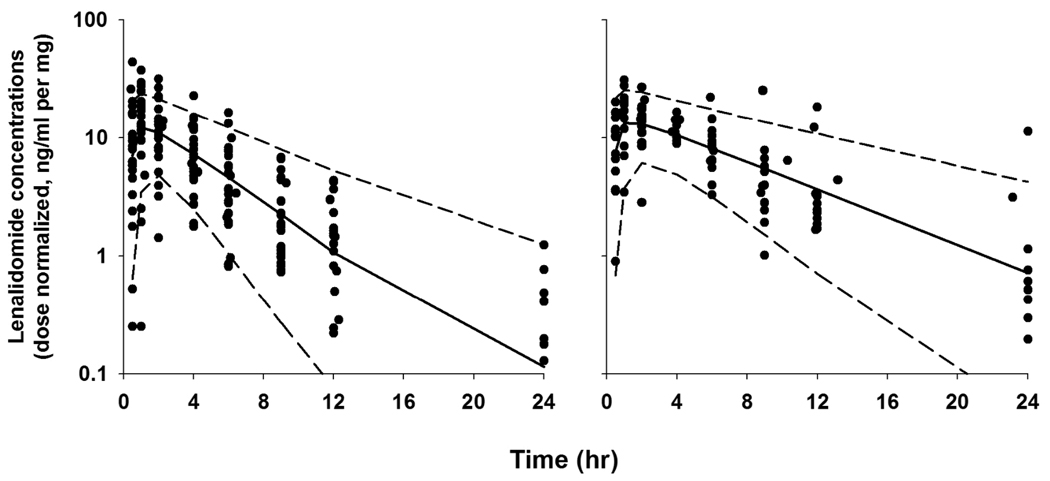
Figure 4.
Visual predictive check for the final pharmacokinetic model. Symbols are observed plasma concentrations of lenalidomide from patients with normal renal function (left panel) and mild RI (right panel). The solid line and broken lines indicate the median and 90% prediction intervals from model-derived simulations. The observations and model-predictions were normalized relative to their dose.

