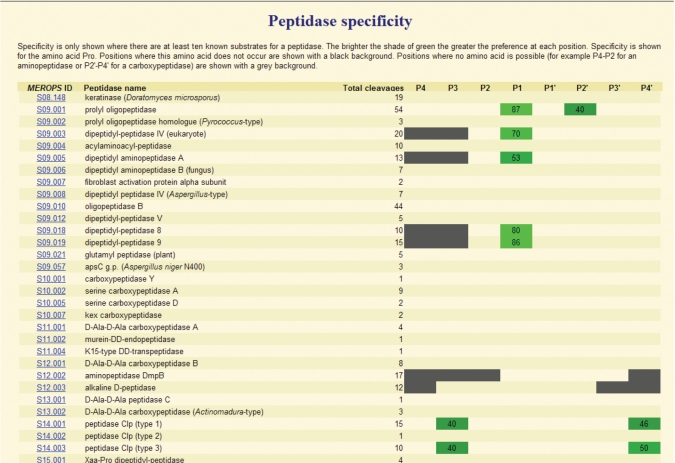
Figure 4.
Comparison of peptidase specificity. The figure shows a portion of a page from the MEROPS website. Peptidase preference for the amino acid proline is shown. The MEROPS identifiers and names of the peptidases are shown on the left, along with the number of substrate cleavages in the MEROPS collection. Where proline occurs in the same position in 40% or more of substrates, the cell is highlighted in green and the percentage of substrates with proline in this position is shown. Cells are only highlighted if 10 or more substrates are known for the peptidase. Where there can be no binding pocket to accommodate a substrate residue, for example in position P4, P3 and P2 for an aminopeptidase or P2′, P3′ and P4′ for a carboxypeptidase, these cells are highlighted in grey.

