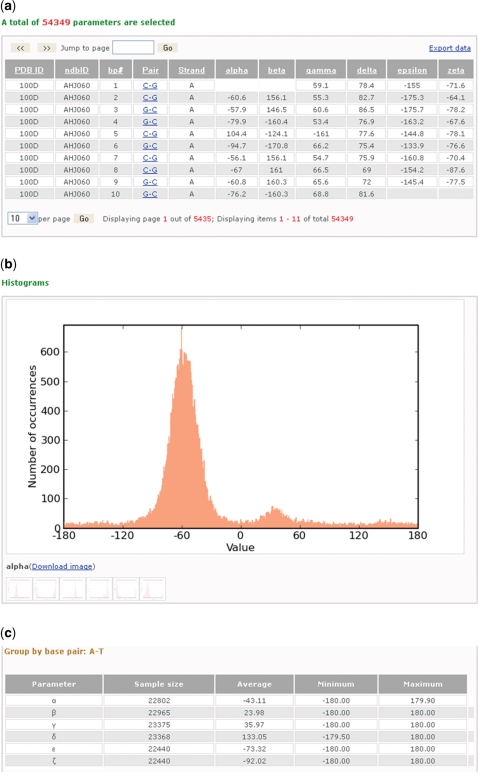
Figure 1.
Screenshots illustrating some of the information about the DNA sugar-phosphate torsion angles collected from a search of the paired nucleotides in all DNA-containing crystal structures of 3 Å or better resolution. (a) A table of 54 349 entries from 1895 different structures arranged in seven columns that respectively list the Protein Data Bank and Nucleic Acid Database identifiers of the structures (PDB ID, NDB ID), the residue number (bp#), the chemical identities of the paired bases (Pair), the strand identity of the first of the two listed bases (Strand) and the values of the six torsion angles (α, β, γ, δ, ξ and ζ) in the specified nucleotides. The data can be sorted by clicking on the headers of the columns and also exported into a tab-delimited file. (b) A close-up of one of the downloadable histograms—here the distribution of the torsion angle α about the O3′–P–O5′–C5′ chemical bond sequence—automatically generated for each of the angles in the above data set. Moving the mouse across the different icons reveals the corresponding distributions for the other angles. (c) Summary of statistical information, including the number of examples, average values, minima and maxima for the torsion angles in the data set. The report is divided into groups based on the type and composition of base pairs, here the canonical A·T Watson–Crick pair.

