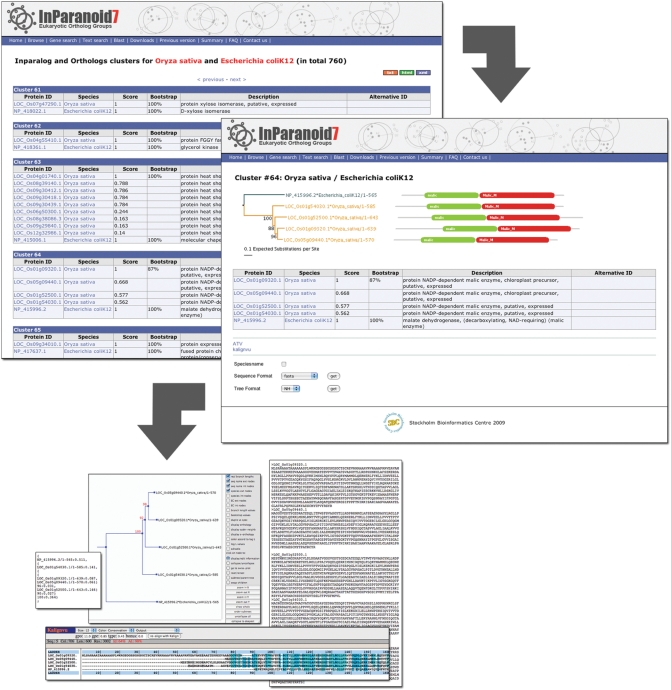
Figure 2.
The new InParanoid web interface. The screenshot in the upper left corner shows the InParanoid clusters between O. sativa and E. coli. For every cluster, i.e. ortholog group, the members are listed with the identifiers of the proteome source and a description. The InParanoid score is shown for every cluster member and bootstrap values are given for the seed orthologs. The bootstrap value indicates the fraction of intracluster bootstrap runs that placed the seed ortholog as the best match. Clicking on the cluster number leads to the details page of the cluster (right), again listing the members and also presenting their domain annotations and a neighbor-joining bootstrap tree of them. In the tree, branches leading to sequences of the same species have the same color, and upon clicking a domain, one is redirected to its Pfam page. In addition, the details page provides a range of possibilities to further investigate the cluster. A multiple sequence alignment can be viewed in Kalignvu (37) or downloaded in various formats such as FASTA, Stockholm, MSF or SELEX. The protein tree can be can be downloaded as picture or in NH format, and it is possible to edit the tree interactively in the ATV tree viewer (38).

