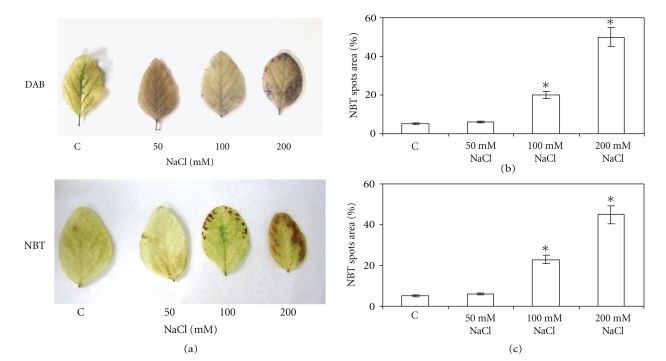
Figure 1.
Histochemical detection of H2O2 and O2 •− in soybean leaves treated with different NaCl concentrations. The second pair of fully expanded leaves upper the cotyledons were used for the assays as described in Experimental section. (a) Leaves from control and NaCl-treated plants stained for H2O2 (DAB) and O2 •− (NBT) content. The figure is representative of four different experiments. Hydrogen peroxide (b) and superoxide anion deposits (c) were quantified by measuring the number of pixels of spots using the NIH Image program (National Institutes of Health, USA). Results are expressed as percentage of spot area versus total leaf area. *P < .05 compared to control, according to Tukey's multiple range test.

