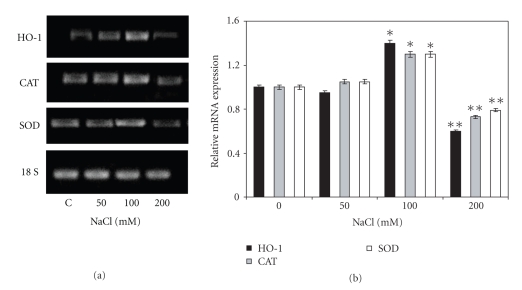
Figure 4.
HO-1, CAT, and SOD gene expression in soybean leaves subjected to different NaCl concentrations (50, 100, or 200 mM) during 10 days. (a) HO-1, CAT, and SOD mRNA expression was analyzed by semiquantitative RT-PCR as described in Section 2. The 18S amplification band is shown to confirm equal loading of RNA and RT efficiency. (b) Relative HO-1, CAT, and SOD transcript expressions. Values are the mean of four independent experiments and bars indicate SD, *P < .01, ** P < .001 with respect to control according to Tukey's multiple range test.

