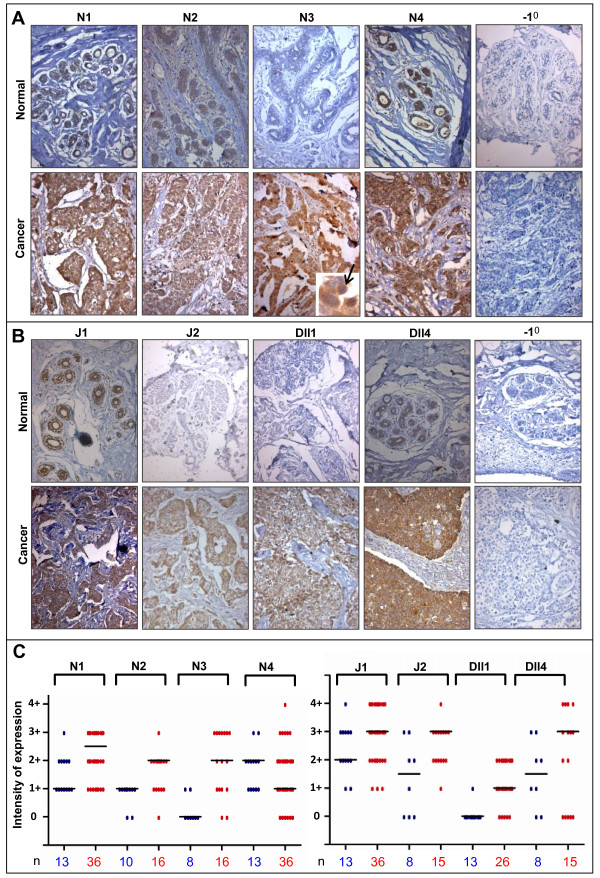
Figure 1.
Overexpression of Notch receptors and ligands in breast cancer. Photomicrographs represent staining of normal and cancerous breast tissue sections with antibodies that recognize (A) Notch1, Notch2, Notch3, Notch4, and (B) Jagged1, Jagged2, Delta-like 1 and Delta-like 4. Inset and arrow in (A) shows nuclear localization of Notch3 in breast cancers. Sections stained in the absence of primary antibodies served as negative controls (-10). Samples were counterstained with haemotoxylin, and images taken at a magnification of 20×. (C) Scatter plot represents expression of Notch receptors and ligands across various normal (blue) and cancer (red) breast tissue samples analyzed. The total number of cases analyzed under each category (n) is mentioned below each column, and the black bar represents the median score.

