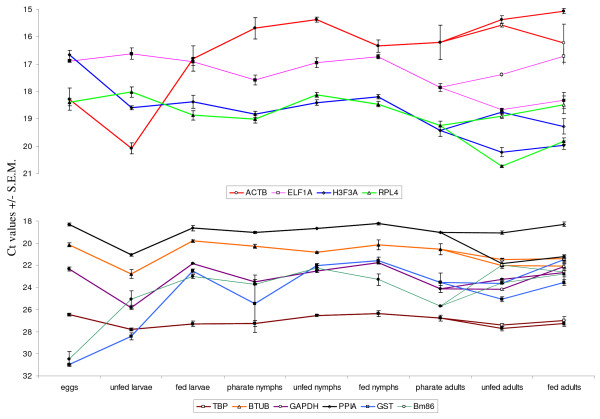
Figure 1.
Bm86 and control gene expression during all life stages of R. microplus. Ct values represent mean +/- SEM from three biological replicates. The Ct values of samples from adult females are indicated with an open symbol, Ct values from adult males with a closed symbol. Note that the y-axis differs in the two panels: highly expressed genes are shown in the top panel, moderately expressed genes in the bottom panel.

