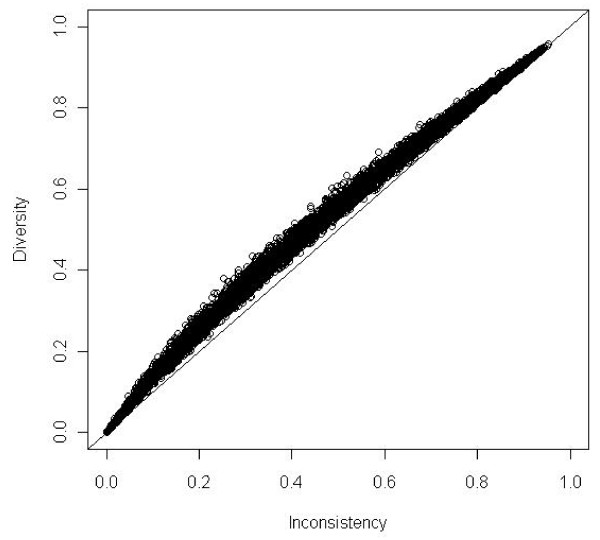
Figure 2.
Diversity (D2) compared to inconsistency (I2) in 10,000 simulations of meta-analyses with number of trials included k = 20. Odds ratio = 0.70 and proportion of events in control group PC = 0.30. Meta-analyses depicted as open circles. D2 nears asymptotically to I2 when heterogeneity nears 0% or 100%. Line of unity, D2 = I2 black line.

