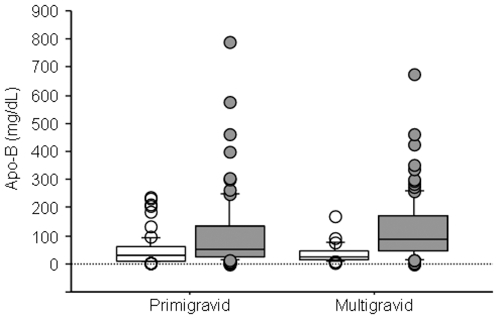
Figure 3. Comparison of peripheral plasma levels of Apo-B between malaria-infected primigravid and multigravid women.
Apo-B in malaria-infected (open boxes) and uninfected (gray boxes) women stratified by gravidity. Numbers of samples tested (infected, uninfected) and the significance of the differences between malaria-infected and uninfected women (P value analyzed by Mann-Whitney U test): primigravid (75, 75; p = 0.0008; multigravid (33, 112; p = <.0001). The box plots include the median (middle line), interquartile ranges (box), and 10–90th percentiles (whiskers).

