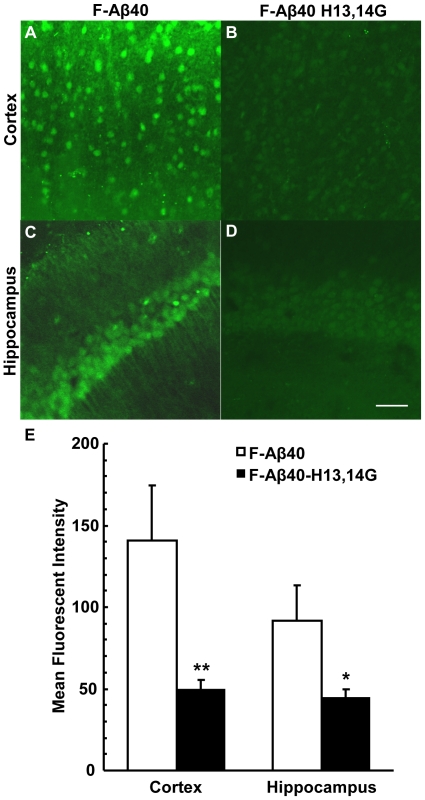
Figure 2. In vitro binding of F-Aβ40 and F-Aβ40 H13,14G in neurons of 4 month old WT brain slices.
(A) Cortex incubated with F-Aβ40. (B) Cortex incubated with F-Aβ40 H13,14G. (C) Hippocampus incubated with F-Aβ40 (D) Hippocampus incubated with F-Aβ40 H13,14G. Scale bar equals 50 µm. (E) Mean fluorescent intensity of cortical and hippocampal neurons from brain slices incubated with F-Aβ40 or F-Aβ40 H13,14G. Analysis of Variance (ANOVA) [F(1,8) = 33.73; p<0.001] followed by Bonferroni post-hoc multiple comparisons: Cortex - **p<0.01; Hippocampus - *p<0.05.

