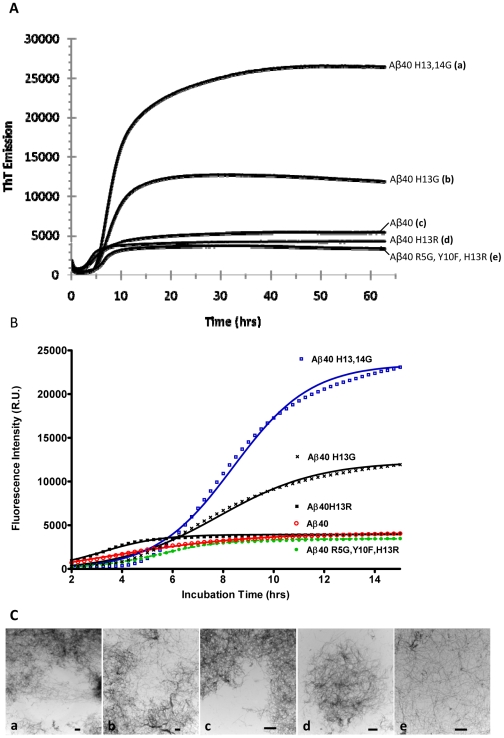
Figure 3. Fibril formation of Aβ derivatives.
(A) Thioflavin T signal versus time of amyloid β peptides. Peptide samples, at 20 µM and containing thioflavin T, were excited at 430 nm and the emissions at 485 nm were monitored over 2.5 days at 37°C with periodic shaking. For each peptide, n = 18. (B) Thio-T fluorescence representing the fibril formation kinetics of various Aβ40 derivatives fitted to the Finke-Watzsky 2-step aggregation model [36]. The observed data has been indicated by various symbols. The predicted data obtained through curve-fitting is presented as solid lines. (C) TEM confirmation of the presence of amyloid fibrils formed by the corresponding amyloid β peptide described in panel A (a: Aβ40 H13,14G; b: Aβ40 H13G; c: Aβ40; d: Aβ40 H13R; e: Aβ40 R5G, Y10F, H13R). The sample was collected at the end of the fibril formation experiment and applied to a grid and negatively stained with uranyl acetate. Scale bar equals 1 µm.

