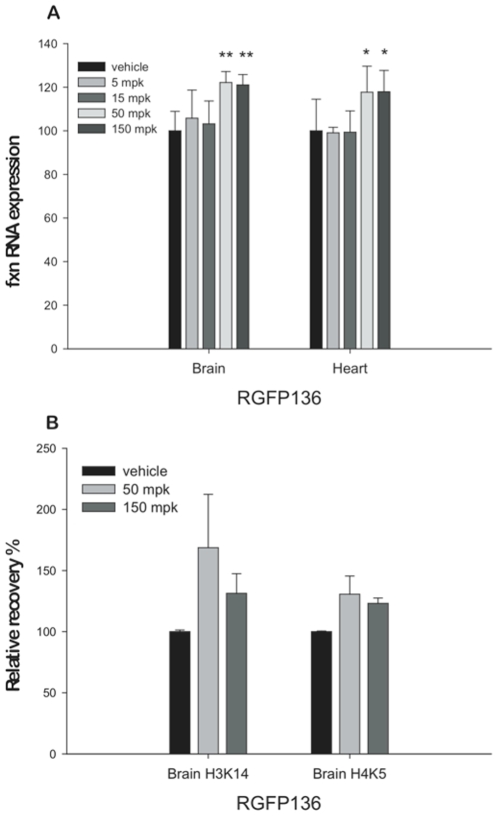
Figure 3. Frataxin expression changes as function of drug 136 dosage.
A. Fxn mRNA measurement by quantitative real-time RT-PCR in brain and heart of KIKI mice dosed subcutaneously with 136 at 5 (n = 7), 15 (n = 7), 50 (n = 6) or 150 (n = 6) mg/kg or vehicle (n = 13) as negative control. Fxn levels were relative to RER1 and beta-2 microglobulin (β2M). The Fxn level in vehicle injected KIKI of each tissue was set to 100. All quantifications were done in triplicate and bars indicate s.d. (** p<0.001; * p<0.05). B. Levels of H4K5 and H3K14 acetylation in KIKI mice brain treated with one subcutaneous injection of 50 or 150 mg/kg of 136 compared to vehicle-treated KIKI littermates (n = 4). We performed ChIP experiments with antibodies for murine histones H3 and H4 carrying each modification. Primer pairs corresponded to the first intron of the mouse frataxin gene just upstream of the point of insertion of the GAA repeat in KIKI mice. Relative recovery, determined by qPCR, is expressed in relation to GAPDH and the recovery in samples from vehicle treated KIKI animals is set to 100 for each antibody. Each immunoprecipitation was quantified in triplicate, Error bars are s.e.m.

