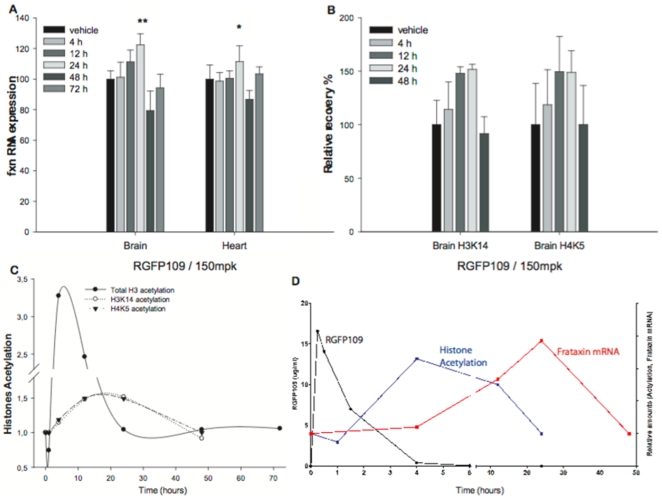
Figure 4. Time course for drug exposure, frataxin mRNA expression, and histone acetylation changes in the brain and heart of KIKI mice.
A. Fxn mRNA measurement by quantitative real-time RT-PCR in brain and heart of KIKI mice dosed subcutaneously with 109 at 150 mg/kg (n = 26) or vehicle (n = 13). Treated mice were sacrificed at one of the mentioned time points: 4, 12, 24, 48 or 72 h. Vehicle treated mice were sacrificed 24 hours after injection. Fxn mRNA levels were relative to RER1 and beta-2 microglobulin (b2M). The Fxn level in vehicle injected KIKI of each tissue was set to 100. All quantifications were done in triplicate and bars indicate s.d. (** p<0.001; * p<0.05). B. Levels of H4K5 and H3K14 acetylation in KIKI mice brain treated with one subcutaneous injection of 150 mg/kg of 109 compared to vehicle-treated KIKI littermates, after 4, 12, 24 or 48 hours (n = 4 for each shown time point). We performed ChIP experiments with antibodies for murine histones H3 and H4 carrying each modification. Primer pairs corresponded to the first intron of the mouse frataxin gene just upstream of the point of insertion of the GAA repeat in KIKI mice. Relative recovery, determined as previously (Fig. 3B) is set to 100 for each residue. Each immunoprecipitation was quantified in triplicate. Error bars are s.e.m. C. Brains from wild-type mice for total histone H3 acetylation and from KIKI mice for specific residues acetylation, injected with either vehicle or with 150 mg/kg of 109, were harvested after a period of 1, 4, 12, 24, 48 or 72 hours (n = 5 per condition) and subjected to western blot with total or acetylated histones H3 antibodies for WT samples or to chromatin immunoprecipitation for KIKI samples. Ratio of acetylated H3 over total H3 is plotted, showing a peak of acetylation at 4 hours. Recovery of specific residues is plotted, showing a plateau between 12 and 24 hours. D. Composite graphic of 109 measures in mouse brain: in black, drug 109 exposure measured in µg/ml; in blue, total histone acetylation from western blot quantification (panel C); in red, fxn RNA as determined by qPCR in panel A.

