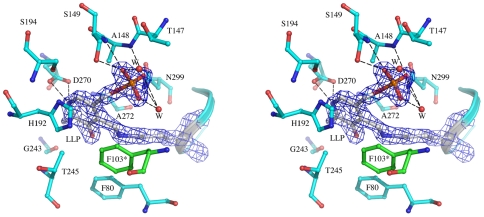
Figure 3. The drDDC active site.
A stereo view of the active site in the drDDC structure. The LLP and the protein residues within a 4 Å distance of the cofactor are shown. Only the 2F o - F c electron density map covering the LLP is shown contoured at the 1.8 sigma. Hydrogen bonds are shown in dashed lines.

