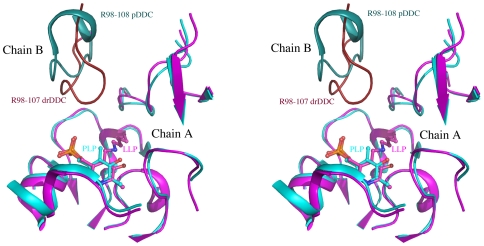
Figure 4. Superposition of drDDC structure onto pig DDC structure.
The protein portions within 12 Å of the active center are shown in the schematic representation in stereo. Pig DDC and drDDC chain As are colored in cyan and magenta, respectively; and their chain Bs are colored in deep teal and brown, respectively.

