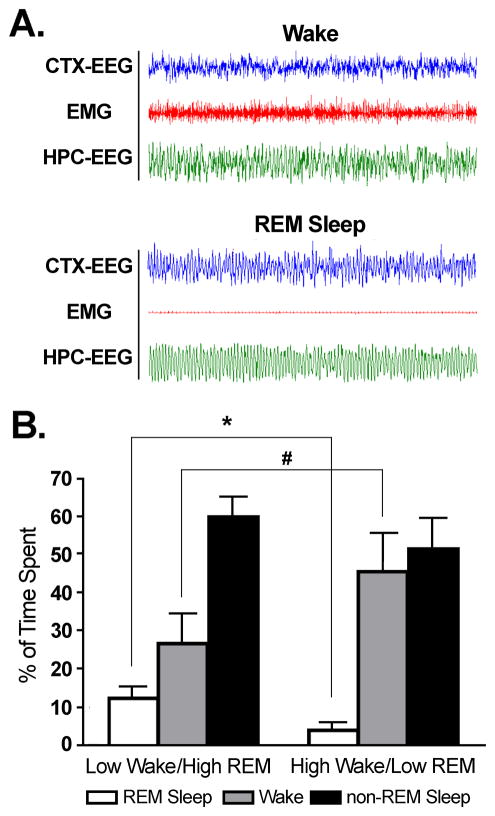
Figure 1.
Polygraphic recording traces differentiating behavioral states W and REM sleep. A. Polygraphic trace profiles representative of W and REM sleep. In the REM sleep traces, there is a lack of muscle tone in the EMG, and presence of the theta wave in the HPC-EEG. B. An analysis of the mean percentage of time spent in REM sleep, wake, and non-REM sleep. Examination of the mean percentage of time spent in REM sleep revealed low W/high REM sleep subjects spent significantly significantly more time in REM sleep (13.27%) compared to high W/low REM sleep subjects (4.06%; t = 7.130, p < 0.0001), while an analysis of the mean percentage of time spent in wake revealed low W/high REM sleep subjects spent significantly less time in wake (24.97%) compared to high W/low REM sleep subjects (46.16%; t = 3.510, p = 0.0066). In contrast, an analysis of the mean percentage of time spent in non-REM sleep revealed no difference between the high REM sleep and low REM sleep conditions (t = 0.8967, n.s.). * indicates a significant difference <0.01; # indicates a significant difference <0.001.

