
Figure 5.
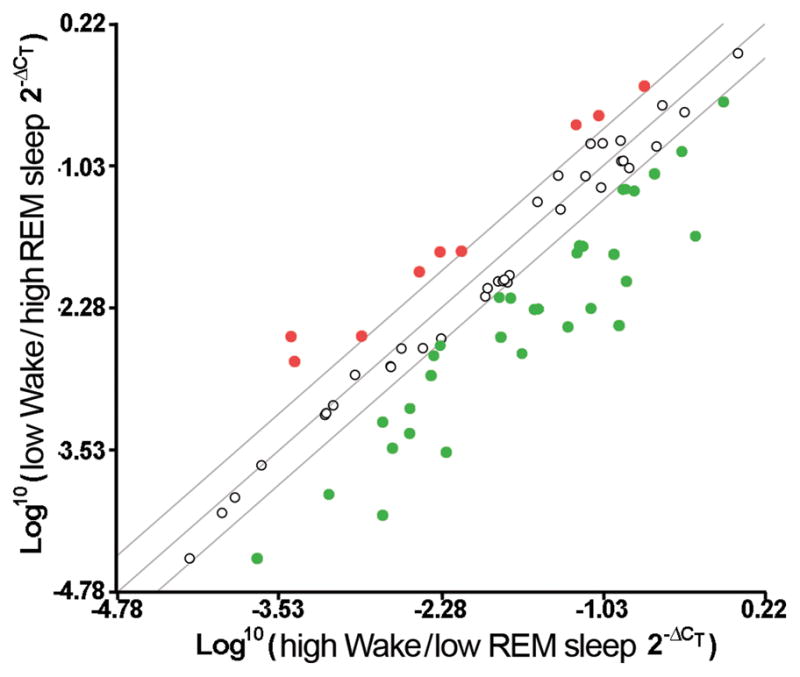
A scatter plot of fold changes in gene expression between a low W/high REM sleep and a high W/low REM sleep subject. Fold changes were determined by raising 2 to the power of the negative value for each ΔCT and subsequently calculating the Log10 for each. Examination of fold changes greater than 2.5 revealed 9 genes whose expression was elevated in low W/high REM sleep compared to high W/low REM sleep (each represented by a red circle), while examination of fold changes less than −2.5 revealed 28 genes whose expression was reduced in low W/high REM sleep compared to high W/low REM sleep (each represented by a green circle). In addition there were 49 genes whose expression did not vary between the low W/high REM sleep and high W/low REM sleep conditions, with fold changes less than ± 2.5.