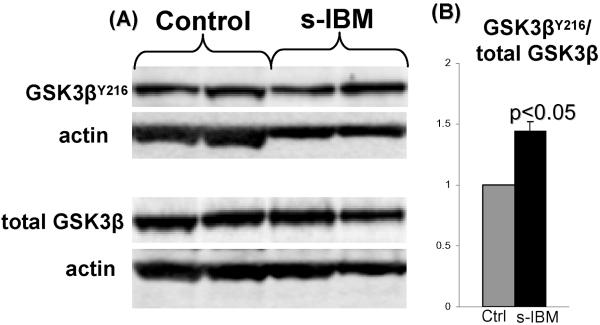
Fig. 2.
GSK3β is activated in s-IBM biopsied muscle. (A) Representative immunoblots of normal control and s-IBM muscle biopsies. B) The ratio of GSK3βY216 to total GSK3β, obtained by densitometric analysis of protein bands, shows that in s-IBM, as compared to controls, GSK3βY216 is significantly increased (p< 0.05, 2 tail Student’s t-test). ± SEM.

