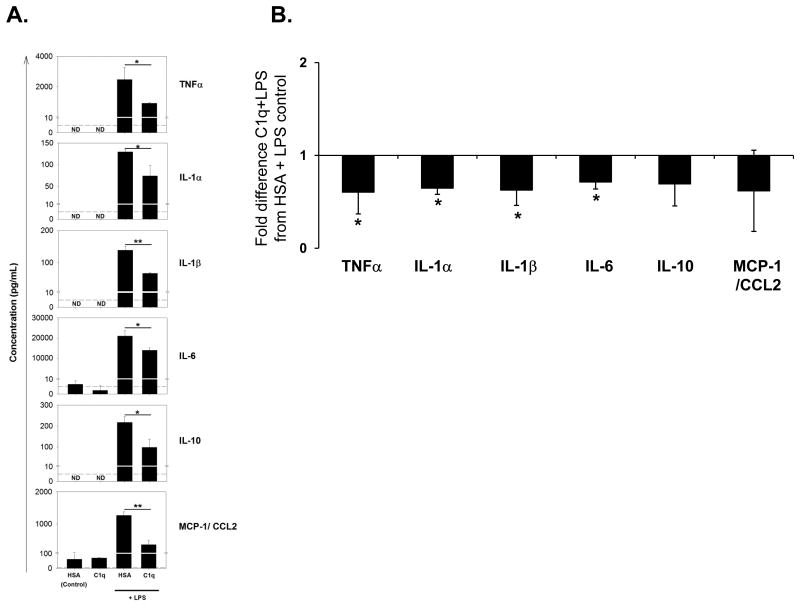
Figure 4. Modulation of LPS-induced proinflammatory cytokines released by rat microglia by C1q.
Cytokine levels were measured by Luminex multiplex analysis of the supernatant of unstimulated microglia plated on LabTek chamber slides coated with 8 μg/mL C1q or HSA control, or identically treated cells stimulated with 150ng/mL LPS for 18 hours. (A.) Data shown are average cytokine levels from an individual experiment, measured in triplicate +/- SD. *p<0.05, **p<0.01, students t-test. Dashed line represents the lower limit threshold of detection. ND – not detected. (B.) Results are expressed as fold difference in expression in supernatants of microglia on C1q-coated slides and stimulated with LPS compared to control levels from cells incubated in wells coated with HSA and stimulated with LPS. Data are the average values of 3 separate experiments, each performed in triplicate +/- SD. * p<0.05, ANOVA.

