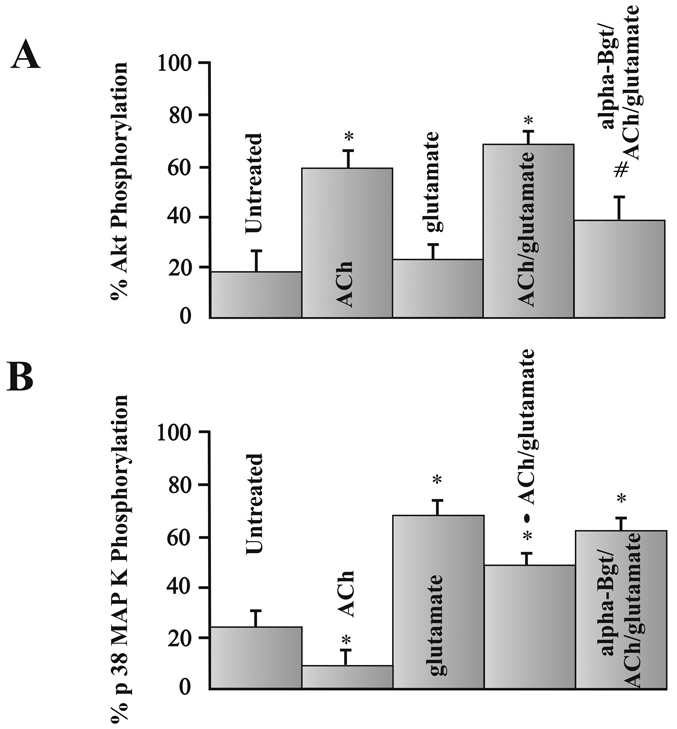
Figure 4.
Phosphorylation of Akt and p38 MAP kinase. Each bar represents the mean percent of total Akt (fig. 4A) or p38 MAP kinase (fig. 4B) phosphorylation measured using ELISA techniques after isolated RGCs were cultured under various pharmacological conditions for 12 hours. * represents a significant difference from untreated conditions, # represents a significant difference from ACh alone or ACh with glutamate conditions, and the solid circle represents a significant difference from RGCs treated with glutamate, or alpha-Bgt/ACh/glutamate (P <0.05). Data were obtained by repeating experiments 7–12 times. Error bars represent S.E.

