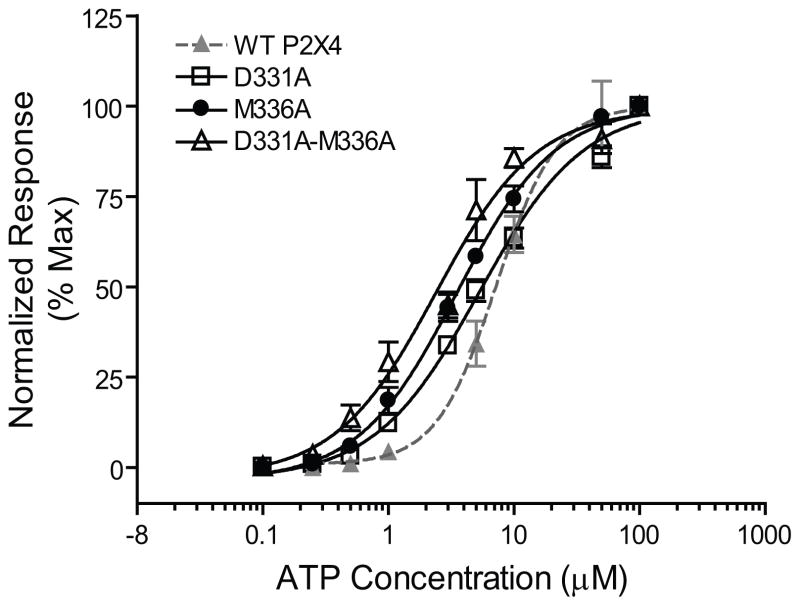
Fig. 1. Concentration-response curves for ATP (0.1–100 μM)-activated currents in Xenopus oocytes expressing WT and mutant (D331A, M336A and D331A-M336A) receptors.
ATP-activated currents were normalized to the maximal current activated by a saturating concentration of ATP (100 μM). The curves represent non-linear regression analysis of the ATP concentration-responses in the WT and mutant P2X4Rs. Details of maximal current amplitude (Imax), EC50 and Hill Slope and are provided in Table 2. The similarity in the ATP concentration-response curves for WT vs. mutant receptors suggesting that the mutants did not markedly alter normal receptor function. Each data point represents the mean ± SEM from at least five different oocytes. Note: the symbol legends for the bottom and top points of the concentration response curves are lying on top of each other and thus appear as a black box at each of these positions.

