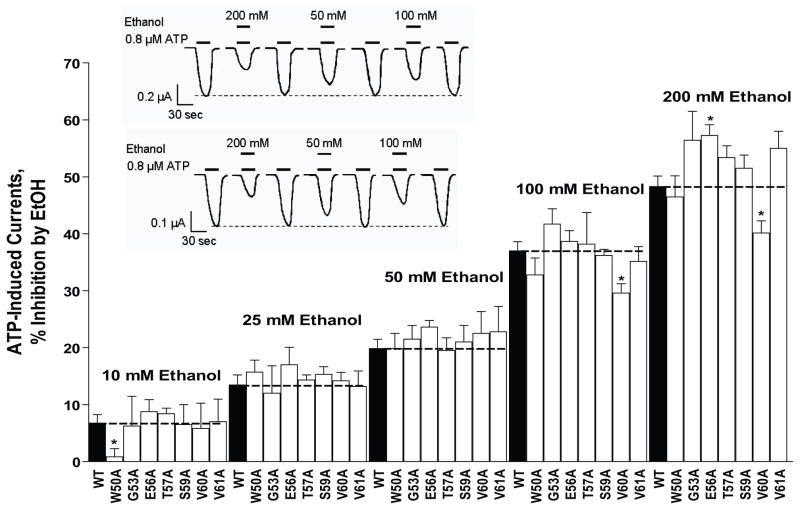
Fig. 2. Effects of ethanol (10–200 mM) in WT and mutant P2X4Rs in the ectodomain- TM1 interface.
In most instances, alanine substitution of residues in the ectodomain-TM1 interface region did not significantly alter ethanol inhibition. The bar graph illustrates the response to ethanol (10–200mM) of WT and mutant P2X4Rs. Data are presented as mean ± SEM, n= 3–8. Inset: Representative tracings of ATP EC10-induced currents and effect of 200 mM, 50 mM and 100 mM ethanol on WT (upper trace) and mutant ([S59A] lower trace) P2X4Rs. The horizontal bars depict when ATP (lower bar) and ethanol (upper bar) were applied to the oocyte. The dashed line illustrates the relative stability of the ATP EC10 over the duration of the experiment. Vertical scale bars are 0.2 and 0.1 μA respectively; horizontal scale bars represent 30 sec.

