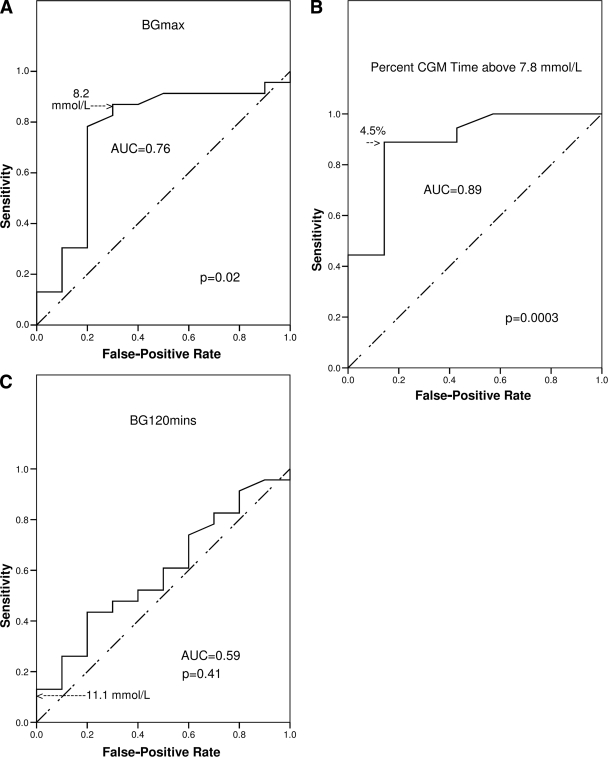
Figure 3.
Determination of optimal glycemic cut points for detecting decline in wtSDS over the preceding 12 months by ROC analysis. A: Plot of sensitivity vs. false-positive rate (1 − specificity) for all possible cut points in BGmax by OGTT. The point closest to the top left-hand corner (8.2 mmol/l) maximizes sensitivity and specificity and is the optimal cut point. B: Percentage of CGM time above 7.8 mmol/l with the optimal cut point of 4.5%. C: Same data for BG120 min on OGTT, which did not detect declining wtSDS. The cut point of 11.1 mmol/l used in the WHO diagnostic criteria is marked.

