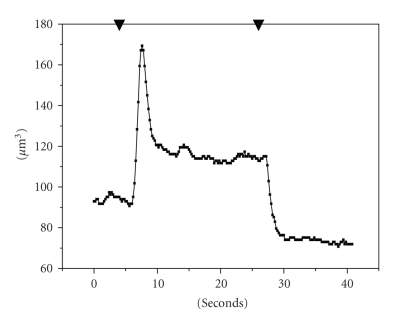
Figure 4.
Effect of hypotonic medium on cell volume of OMCD principal cells (representative curve). Cell volumes were estimated according calcein fluorescence intensity. ▾: gradient signal from the valve: switch from normal PBS [Na+]i 280 mM to hypotonic 0.5 PBS [Na+]i 140 mM, and back to normal PBS. (1) control normal PBS [Na+]i 280 mM. (2) peak of cell volume during swelling. (3) steady state in hypotonic 0.5 PBS [Na+]i 140 mM.

