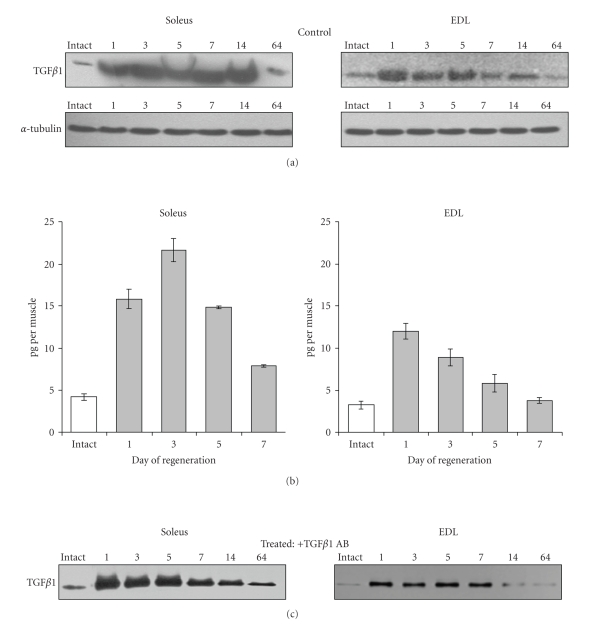
Figure 3.
TGF β 1 protein levels during soleus and EDL muscle regeneration. (a) Representative immunoblots of TGFβ1 performed on extracts from control untreated soleus and EDL muscles taken at the indicated days after crush. Alphatubulin was used as control of loading. (b) TGFβ1 protein amount measured by ELISA during the first week after crush in untreated regenerating muscles (control). Levels of TGFβ1 are shown as pg per muscle fresh weight. In intact soleus and EDL muscles 4.19 pg per muscle and 3.24 pg per muscle were found, respectively. The data represent mean ± SE of 3 independent determinations each of them including 3 animals. All values found in regenerating muscles were statistically different from intact muscles (P < .05) except for EDL day 7. (c) Representative Immunoblots of TGFβ1 in extracts from muscles injected just after crush with anti-TGFβ1 antibody and taken at the indicated days after crush.

