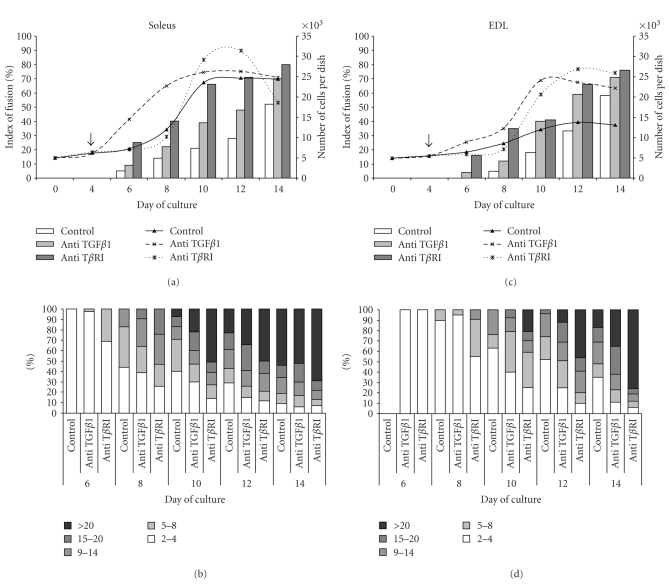
Figure 6.
Growth and differentiation of soleus and EDL derived myoblasts. Effects of anti-TGF β 1 and anti-T β RI antibody treatments. Untreated myoblasts (control) and myoblasts treated at day 4 after plating (arrow) with either anti-TGFβ1 or anti-TβRI antibody were cultured as described above. In the cultures of (a) soleus and (c) EDL derived myoblasts, cellular growth (shown as curves) was measured by counting the cells after trypsin dissociation. Index of fusion (shown as bars) was expressed as the percentage of nuclei found in myotubes compared to the total number of nuclei. Distributions of myotubes (as % of total myotubes) found in (b) soleus and (d) EDL derived myoblast cultures according to their size, depending on the number of nuclei they contained. Counting was performed at the indicated days after plating on cultures stained with May-Grünwald-Giemsa. Values are mean ± SE of three independent cultures.

