
Figure 4.
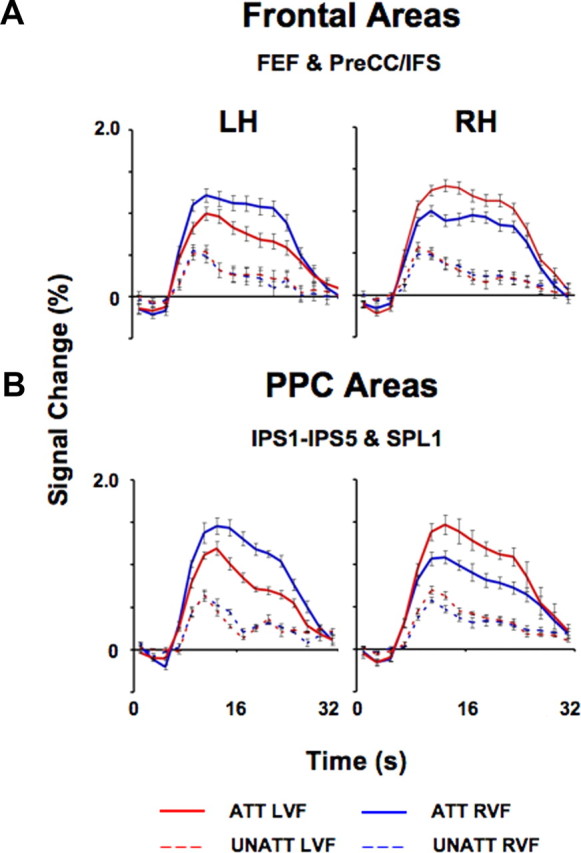
Time series of fMRI attention signals in topographic regions of frontal and parietal cortex. A, B, Spatial attention signals averaged across subjects in topographic regions of frontal (A; n = 9) and parietal cortex (B; n = 8) are shown separately for each hemisphere. Data were averaged across all topographic frontal (FEF, PreCC/IFS; A) and parietal voxels (IPS1–IPS5, SPL1; B) that were activated by a spatial attention task (attended vs unattended contrast). Solid curves indicate activity evoked by the attended conditions (ATT) and dashed curves indicate activity evoked by the unattended (UNATT) conditions. Red curves correspond to directed attention to the LVF, while blue curves correspond to directed attention to the RVF. Error bars indicate SEM across subjects.