
Figure 5.
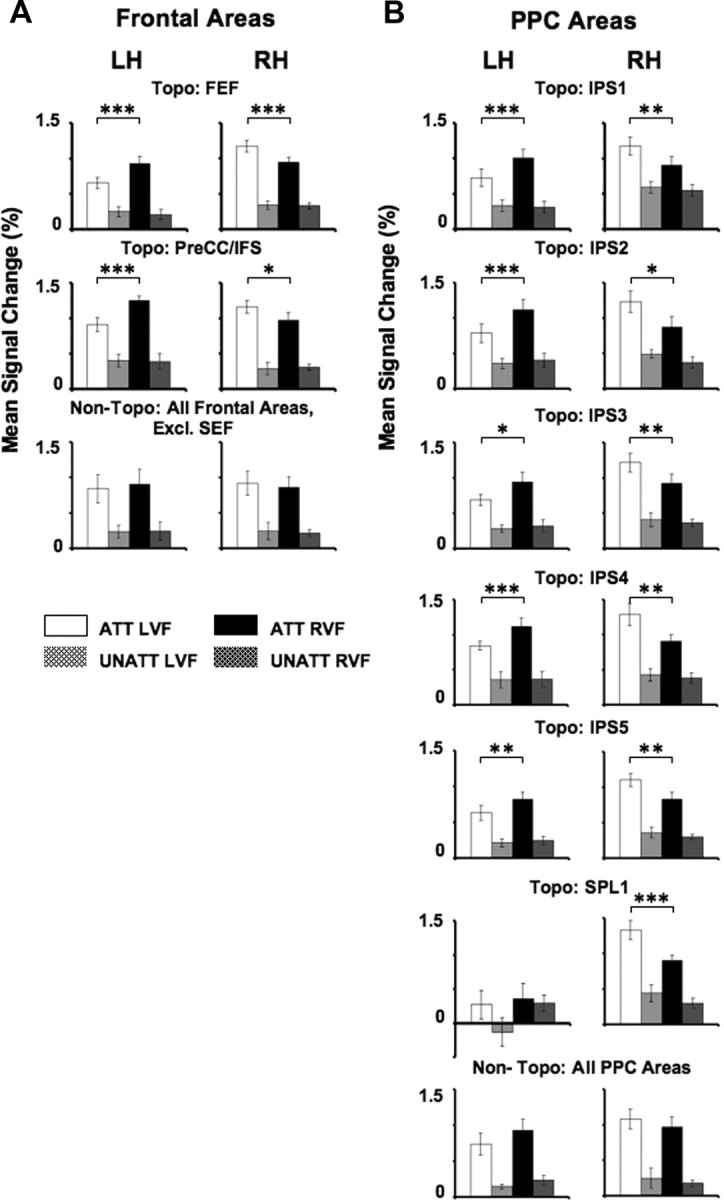
Mean signal changes in frontal and parietal areas. A, B, Mean signal changes obtained during the spatial attention task averaged across subjects are shown for areas within frontal (A) and parietal cortex (B). For each subject, mean signal change was defined as the average of the eight peak intensities of the fMRI signal obtained during each condition. Mean signals are shown separately for each hemisphere and for different ROIs: voxels activated by the spatial attention task (attended vs unattended contrast) that were assigned to topographic areas (Topo) and those that did not overlap with topographic areas (Non-Topo). Mean responses of activations assigned to topographic areas in frontal (FEF and PreCC/IFS) and parietal cortex (IPS1–IPS5, SPL1) are shown separately for each area. Responses were averaged across all frontal and parietal voxels that responded to the spatial attention task but were not topographically organized, with the exception of the SEF. Solid bars indicate activity evoked by the attended conditions (ATT) and hatched bars indicate activity evoked by the unattended (UNATT) conditions. White bars correspond to directed attention to the LVF, while black bars correspond to directed attention to the RVF. Error bars indicate SEM across subjects. *p < 0.05; **p < 0.01; ***p < 0.001.