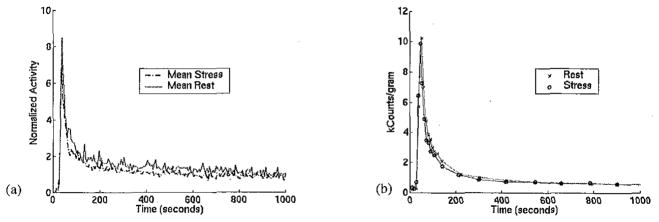
Figure 1.
(a) Average blood input time-activity curves for teboroxime at stress and at rest, from regions of interest drawn on the images of six dog studies. (b) Plasma time-activity curves from one dog study. The input functions are similar at stress and at rest, justifying the use of a single blood input in the simulation.

