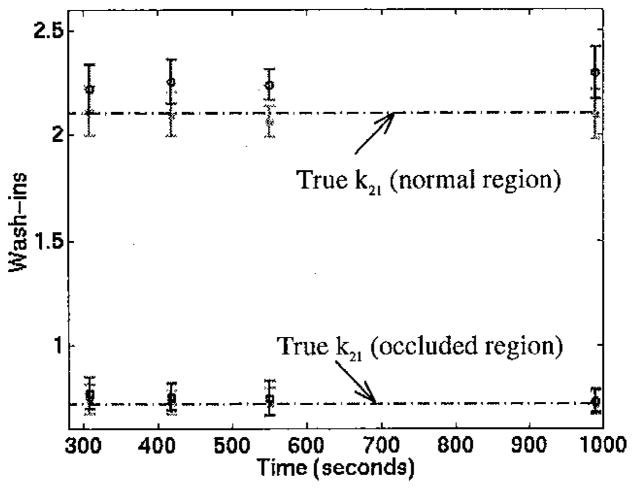
Figure 4.
k21 parameters from simulated data. The lighter symbols marked with * are from 25 noise realizations of continuous stress. The ‘o’ symbols are from the 6 minute stress protocol. The error bars show ± one standard deviation. All of the continuous stress results are not significantly different from the true washin (p>0.05). All of the 6 minute results are significantly different from truth (p<0.05), except when 990 seconds of occluded data is used.

