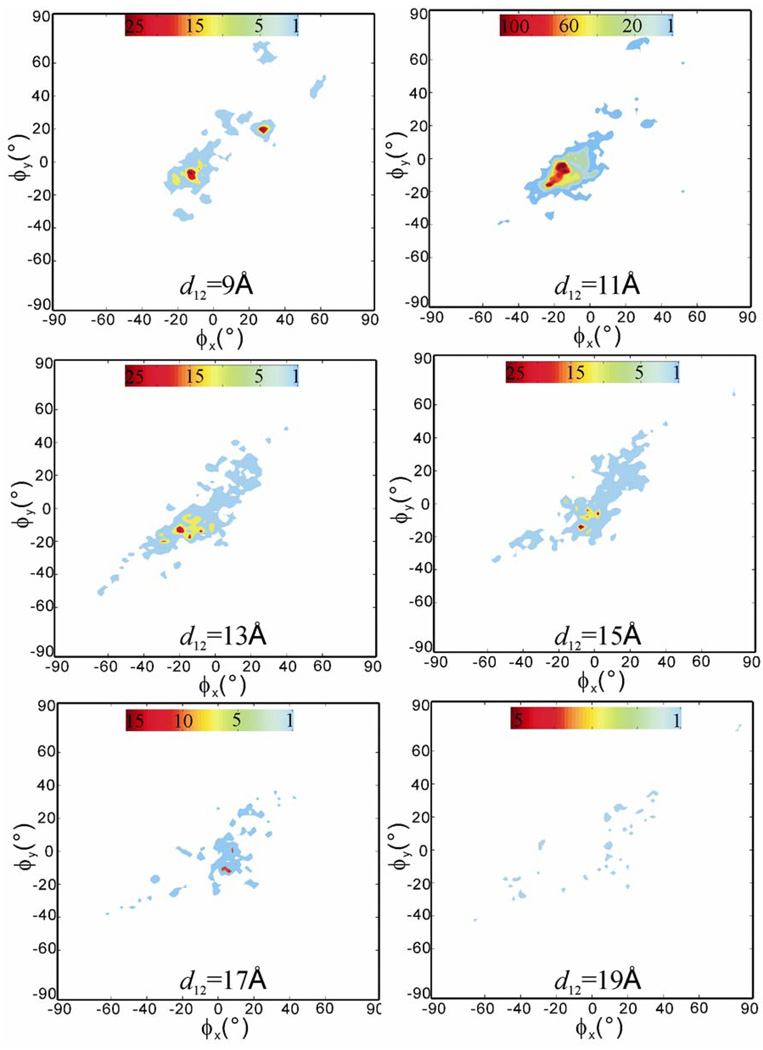
Figure 5.
The computed spatial occupancy maps of the ligand from 100 RAMD trajectories as a function of receptor-ligand center-to-center distance d12 = 9, 11, 13, 15, 17, and 19Å. The starting structure is the ligand-bound crystal structure. Red means high occupancy and blue low occupancy. Note: each map has its own color scale.

