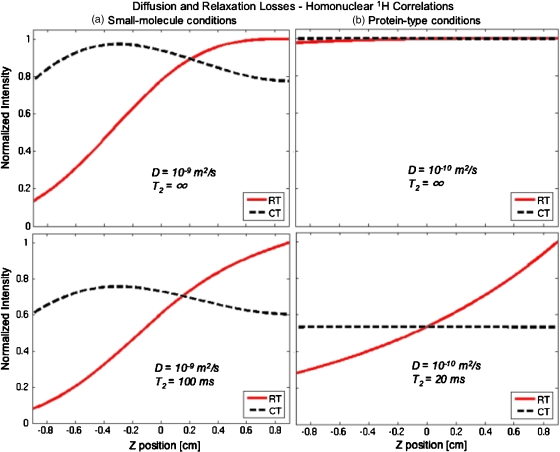
Figure 5.
Comparison between the predictions made by the real-time (RT) and the constant-time (CT) analytical models described in the text for diffusion losses, upon executing homonuclear single-scan 2D correlation on (a) small molecule (left-hand panels) and (b) macromolecular (right-hand panel) spin systems. To put these diffusion effects in perspective, relaxation-free and realistic T2-derived effects are also compared in corresponding top and bottom panels. The real-time plots assumed the sequence in Fig. 2b with Ge=5.2 G∕cm, and 50 ms for the large and small molecule experiments, respectively, Oi=−Of=−20 kHz (notice the sign reversal vis-à-vis in the experiments in Fig. 3) and L=1.80 cm. The constant-time plots used the sequence in Fig. 2c with the same values except for and 25 ms for the large and small molecules, experiments.

