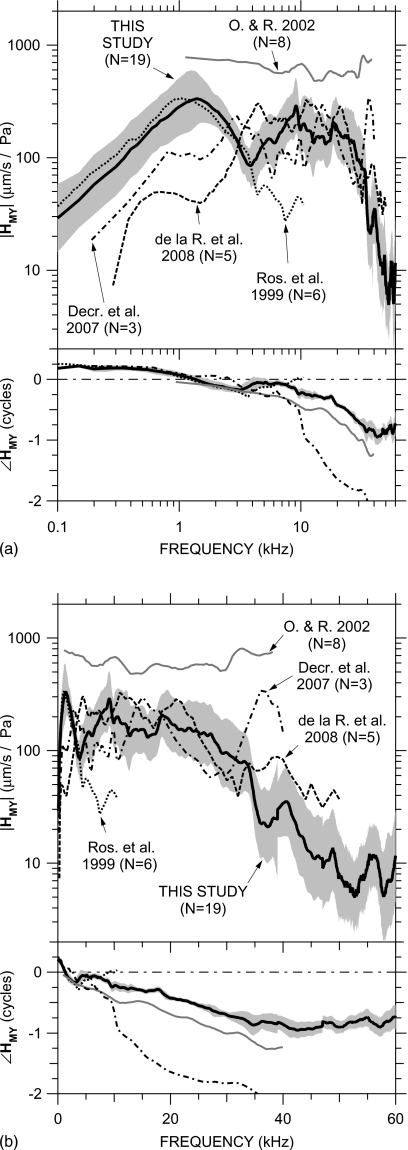
Figure 12.
Comparison of our mean HMY (thick black line)±s.d. (shaded area) to previously published measurements: Rosowski et al. (1999) (logarithmic mean; “Ros. et al.;” dotted); Overstreet and Ruggero (2002) (median; “O. & R.;” gray line), de la Rochefoucauld et al., 2008 (in piston direction; linear mean; “de la R. et al.;” dashed), and Decraemer et al., (2007) (piston, computed in an intrinsic reference frame; logarithmic mean; “Decr. et al.;” dot-dashed). Top: magnitude; bottom: phase. (a) Logarithmic frequency scale; (b) linear frequency scale.

