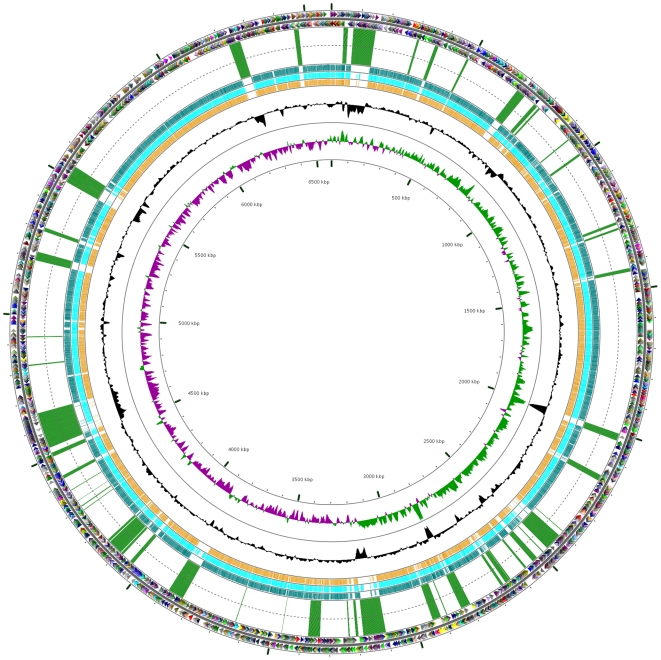
Figure 1. The chromosome of P. aeruginosa PA7.
The outermost two circles indicate positions of CDSs in plus (circle 1) and minus (circle 2) strands colored by functional category: translation, ribosomal structure, and biogenesis (maroon); transcription (navy); DNA replication, recombination and repair (purple); cell division and chromosome partitioning (brown); posttranslational modification, protein turnover, chaperones (aqua); cell envelope biogenesis, outer membrane (teal); cell motility and secretion (blue); inorganic ion transport and metabolism (orange); signal transduction mechanisms (lavender); energy production and conversion (olive); carbohydrate transport and metabolism (light green); amino acid transport and metabolism (dark green); nucleotide transport and metabolism (fuchsia); coenzyme metabolism (pink); lipid metabolism (red); secondary-metabolite biosynthesis, transport, and catabolism (yellow); general function prediction only (dark grey); function unknown (light grey); and no COG (black). Genomic islands or ‘regions of genomic plasticity’ are indicated by green bars in the third circle; these are in the same order as listed in Table 3 (starting from the 0 kbp mark). Moving toward the center, the following three circles map pairwise blastn alignments (expected threshold = 1e−20) between PA7 and previously sequenced P. aeruginosa genomes (circle 4 PAO1 (teal); circle 5 PA14 (aqua); circle 6 LESB58 (orange)). Circle seven shows G+C content (deviation from average), and the eighth circle illustrates G+C skew in green (+) and purple (−). The scale (in kbp) is indicated on the innermost circle. CGview software [43] was used to construct the genome map.

