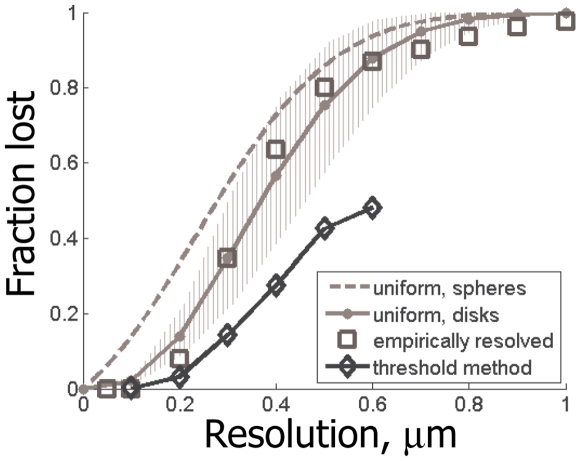
Figure 7. Best quality of synapse detection using the threshold method, for different LM resolutions.
For comparison also shown: the fraction of optically resolvable synapses in theoretical model of “spherical” synapses (dashed gray line), the fraction (solid gray line) and the range (grayed area, for different synaptic densities from 1 µm−3 to 2 µm−3) of optically resolvable synapses in theoretical model with “disk-shaped” synapses, and the empirical fraction of optically resolvable synapses determined from our EM reconstruction data (squares).

