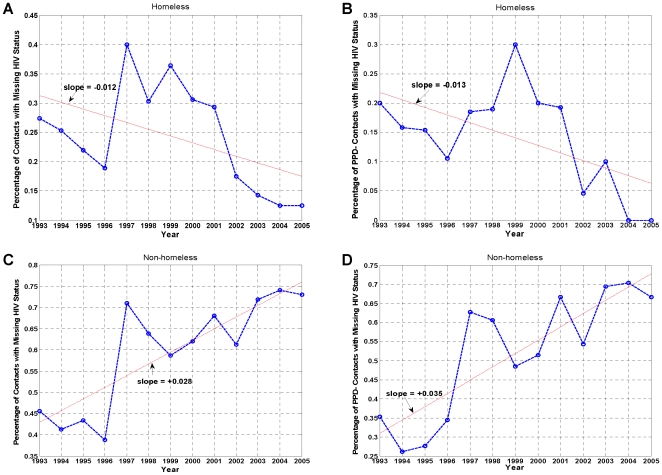
Figure 3. Annual percentage of all contacts and PPD− contacts with missing HIV status, January 1993–December 2005.
(A and B) Homeless. (C and D) Non-homeless. In A and C, contacts include both PPD+ and PPD− individuals. While the reporting of HIV status has improved over time among all contacts and PPD− contacts in the homeless population (negative slopes), it has worsened among the non-homeless (positive slopes). Red line: linear fit.

