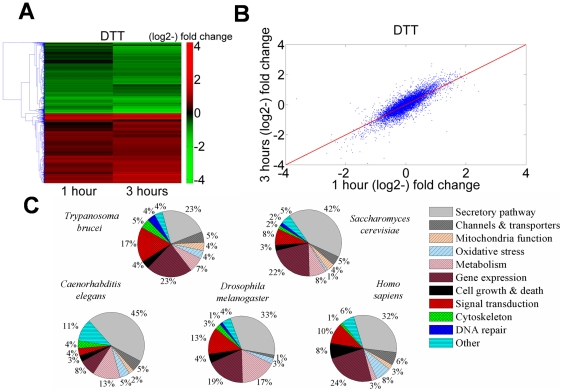
Figure 1. Transcriptome changes in T. brucei treated with DTT resemble analogous changes in other eukaryotes.
A. Heat map of genes that are differentially regulated in cells treated with 4 mM DTT for 1 or 3 hrs relative to untreated cells. Transcripts that differ from the control by >1.5-fold change were chosen for the analysis. Each column represents the average of three biological replicates. The heat map was generated using the average linkage hierarchical clustering algorithm and Euclidean distance as a similarity measure. The diagram represents the differential expression level according to the following color scale: red- up-regulated genes; green- down-regulated genes. B. Scatter plot analysis showing correlation of the transcriptome data from trypanosomes treated with 4 mM DTT for 1 or 3 hours. C. Pie diagram of up-regulated genes during UPR in four organisms (Table S3), compared to the response in T. brucei (Table S2). Data were obtained for the following organisms. S. cerevisiae [3]; C. elegans: [33]; D. melanogaster [34]; H. sapiens: [35] (see Table S3).

