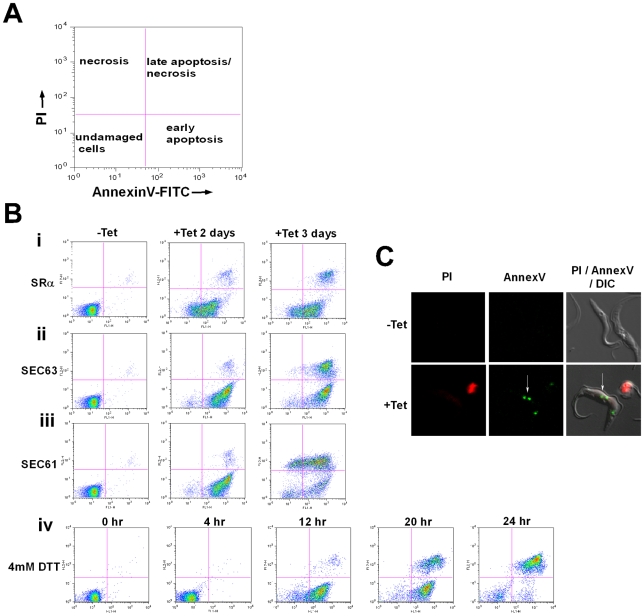
Figure 7. Phosphatidylserine exposure during SLS induction.
A. Diagram showing the different cell populations detected by staining with AnnexinV and PI. B. Analysis of exposed phosphatidylserine on outer membrane of SLS induced cells. Uninduced cells (-Tet) or cells silenced for 2 and 3 days (+Tet), and cells treated with DTT for 0, 4 12, 20 and 24 hours were reacted with fluorescein isothiocyanate-labeled AnnexinV antibodies (MBL©) and stained with propidium iodide according to the manufacturer's instructions. The cells were analyzed by FACS. The panels represent i. SRα silenced cells; ii. SEC61 silenced cells; iii. SEC63 silenced cells; iv. DTT treated cells. C. AnnexinV - PI staining of SLS induced cells. SRα cells were silenced for 3 days (+Tet). Uninduced and silenced cells were stained with AnnexinV and PI, fixed with 4% formaldehyde and visualized. The exposed phosphatidylserine in propidium iodide negative cells are marked by a white arrow.

