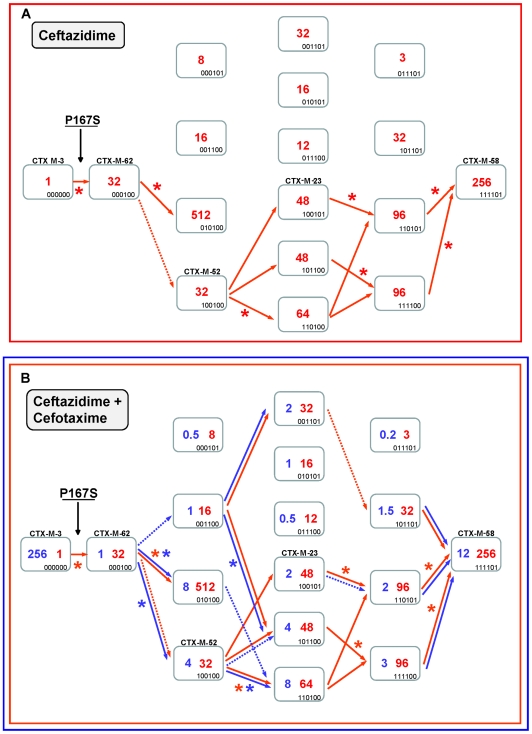
Figure 4. Mutational pathways showing the diversification of CTX-M-3 towards the most evolved variants, determined by step-by-step site-specific mutagenesis: the P167 pathway.
Different CTX-M-3 evolutionary scenarios are shown depending on the acquisition of P167S (Figure 4) or D240G (Figure 5) mutations in the first step or in the absence of these changes (Figure 7). Each rectangle represents a particular CTX-M-3 derivative obtained by introduction of mutations predicted to be under positive selection (A77V, N114D, P167S, D240G and D288N) and A140S in cumulative steps towards the most complex mutant (containing all mutations analyzed in each pathway). The binary code indicates the content of mutations in each CTX-M variant in this order: A77V, N114D, A140S, P167S, D240G and D288N. Variants identical or closely related with enzymes already detected in nature appear with the corresponding CTX-M designation. Numbers inside the rectangles indicate MIC values (µg/ml) of ceftazidime (A) or both cefotaxime and ceftazidime (B) observed for MI1443 E. coli cells carrying a recombinant plasmid containing each corresponding mutant. Possible trajectories identified are shown with arrows. Filled arrows indicate evolutionary steps predicted to be favored by selection, whereas dotted arrows represent steps associated with neutral events and thus fixed by drift. Deleterious steps (associated with negative changes in fitness) are not shown. Asterisks indicate significant (using Mann-Whitney tests) increases in MIC between the corresponding mutants.

