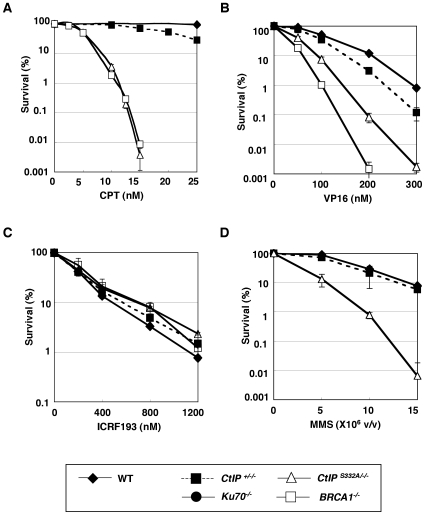
Figure 5. Colony survival assay of CtIP mutant cells to various genotoxic agents.
Colony survival assay of asynchronous populations of cells exposed to (A) camptothecin (CPT), (B) etoposide (VP16), (C) ICRF-193, and (D) methyl methanesulfonate (MMS). The dose is displayed on the X axis on a linear scale, while the percent fraction of surviving colonies is displayed on the Y axis on a logarithmic scale. To count the surviving colonies, cells were grown for 8–10 days in methylcellulose medium containing various concentrations of DNA–damaging agents. At least three independent experiments were performed with triplicate samples, and the representative results are shown. The error bars indicate S.D.

