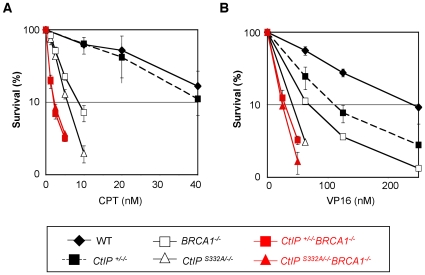
Figure 6. Epistasis analysis of BRCA1 and CtIP in cellular tolerance to topoisomerase inhibitors.
Cellular survival of each genotype was assessed by measuring the amount of ATP in cell lysates after 48-h exposure to CPT (A) or VP16 (B). The survival curves for the CtIPS332A/−/−BRCA1−/− cells and their control CtIP+/−/−BRCA1−/− cells are depicted in red. At least five independent experiments were performed with triplicate samples, and the representative results are shown. The error bars indicate S.D.

