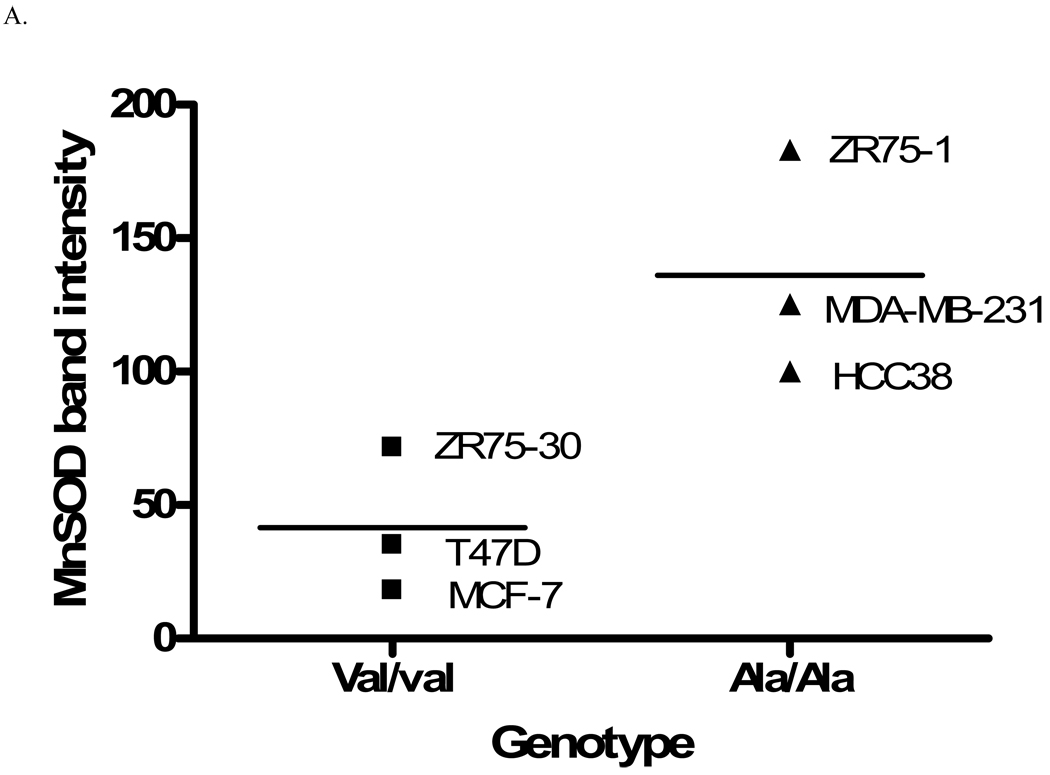
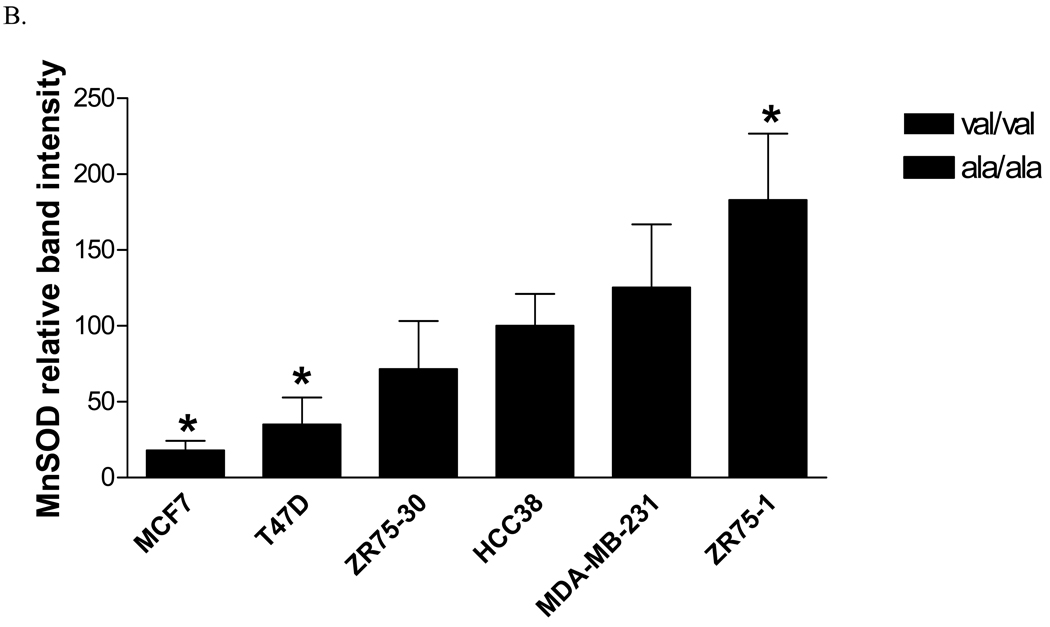
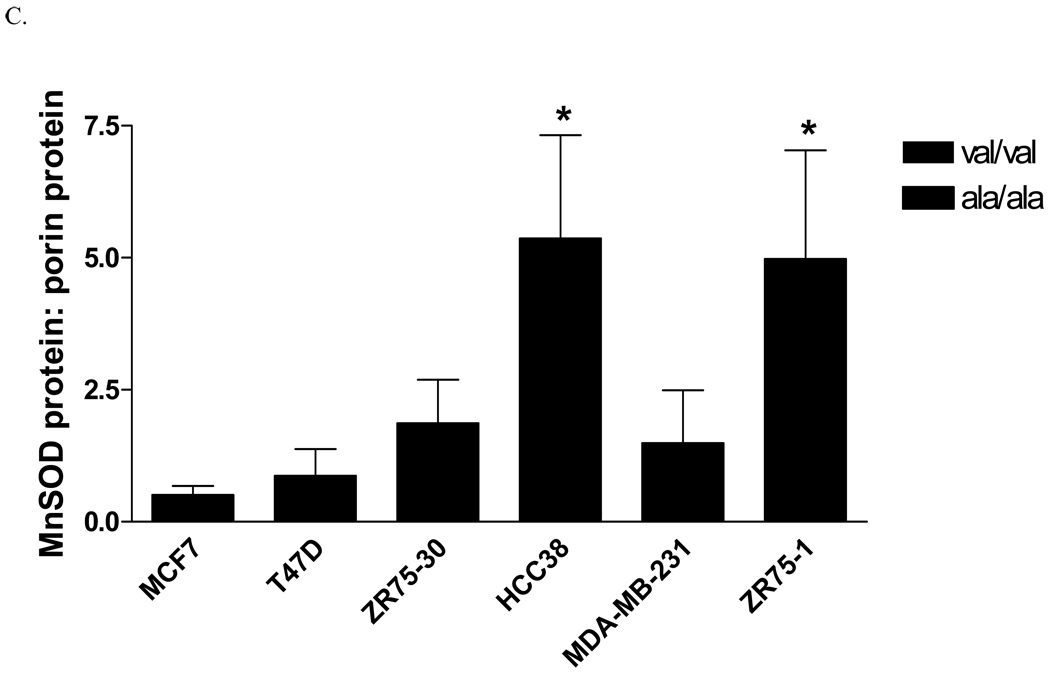
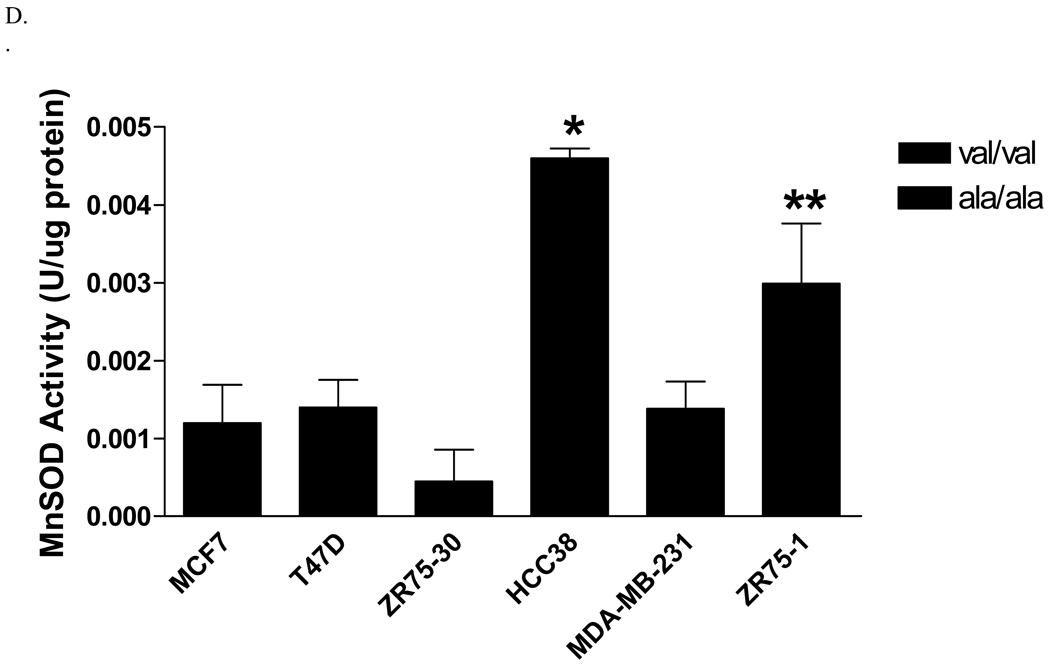
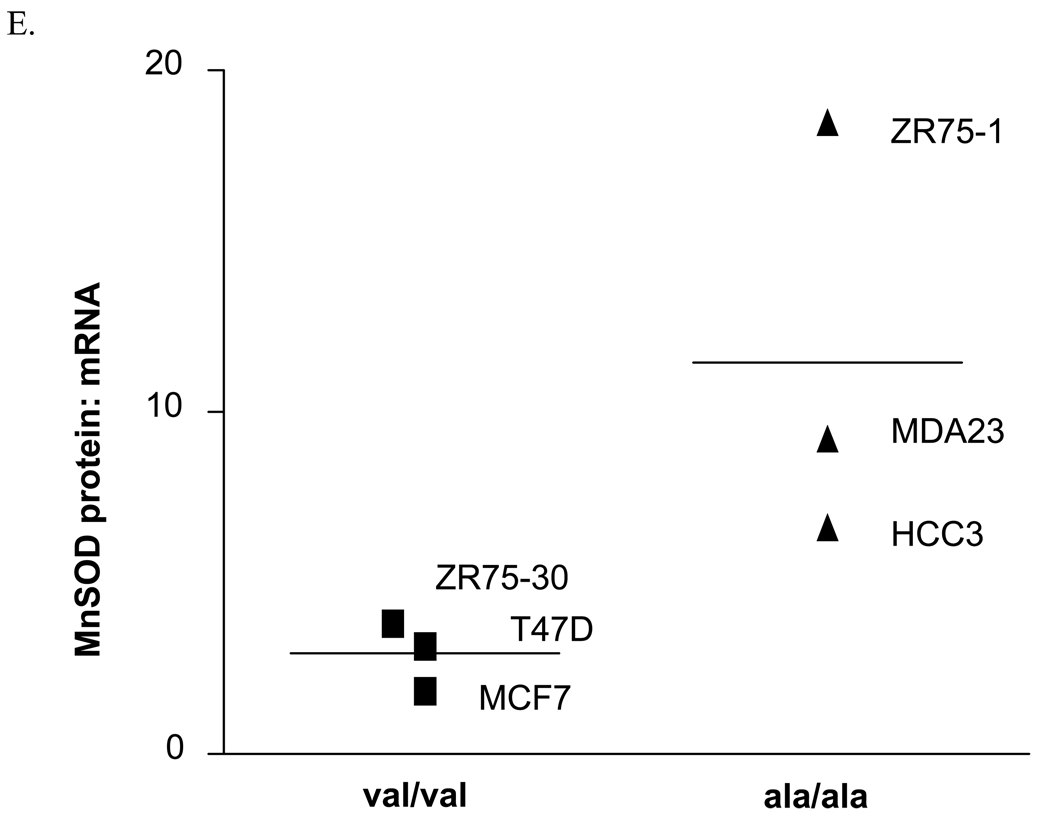
Fig. 1. Analysis of MnSOD protein, activity, and mRNA expression levels in human breast cancer cell lines.
A. Average MnSOD protein levels by genotype. Each point represents the average MnSOD expression for each cell line (n=3) and the bar is the average of all three cell lines. The ala/ala cell lines analyzed as a group had significantly more MnSOD protein expression that the val/val cell lines (p<0.05). B. MnSOD protein expression in individual cell lines (*MCF7 and T47D are significantly different from ZR75-1, p<0.01). C. MnSOD protein adjusted for mitochondrial density represented by porin protein levels (*p<0.05 versus MCF-7 and T47D). D. MnSOD enzymatic activity (*p<0.05 versus MCF-7, T47D, ZR-75-30, and MDA-MB-231, **p<0.05 versus ZR-75-30). E. MnSOD protein corrected for MnSOD mRNA expression (p=0.08). All experiments were completed in triplicate (n=3 ± SD)

