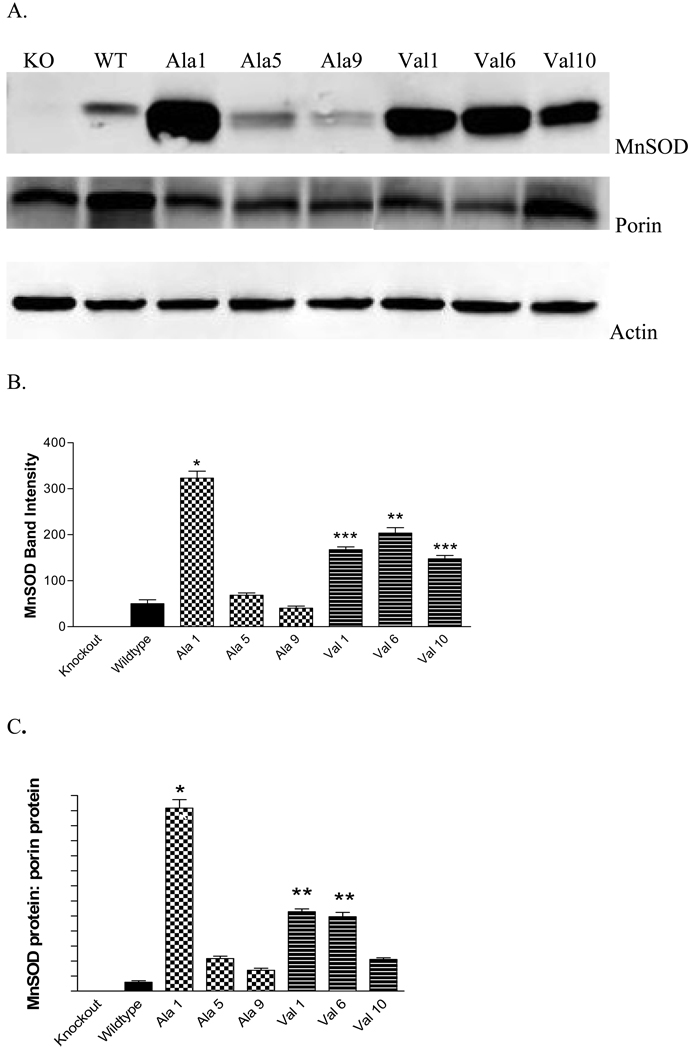
Fig. 2. Quantification of MnSOD protein in MEF transformant cell lines.
MEF cells were stably transfected with human MnSOD ala or val and selected by continuous growth in Zeocin. (A.) Representative Western blots of MEF cells transfected with human MnSOD. Top gel is immunoblotted for MnSOD, middle gel for porin, bottom gel for actin (loading control). (B.) MnSOD protein expression in MEF cells from the SOD2−/− mouse. Human MnSOD expression as determined by Western blot. MnSOD-ala1 (*) and MnSOD-val6 (**) lines are significantly different from all other cell lines (p<0.05). (***) MnSOD-val1 and MnSOD-val10 have significantly more MnSOD than the wildtype line, MnSOD-ala5 and MnSOD-ala9 (p<0.05). Each bar represents the average of three experiments, ± SD. (C.) MnSOD protein adjusted for porin protein. Porin protein was used to quantify mitochondrial density. * Indicates significantly different from all other cell lines (p<0.01). ** Indicates significantly different than all other lines (p<0.05)

