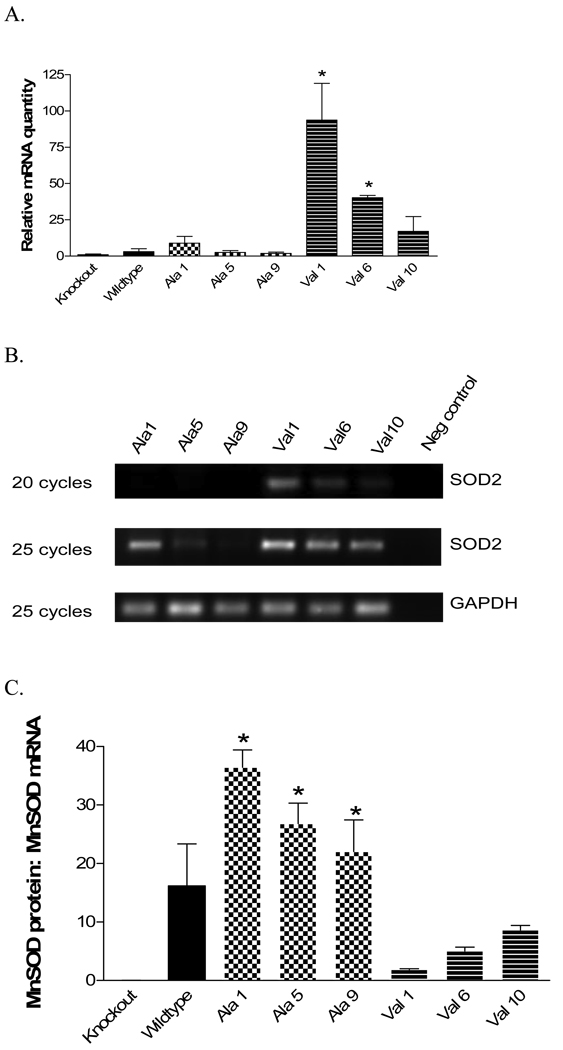
Fig. 4. MnSOD mRNA expression.
MnSOD mRNA levels were quantified by TaqMan real-time PCR and reverse transcription PCR. (a.) Real-time PCR of MnSOD transformant cell lines. * Indicates significantly greater than other cell lines (p<0.05). Each bar represents the average of three independent determinations, ± SD. (b.) Amplification in exon 3 of MnSOD at either 20 or 25 cycles of PCR amplification. Bands are visible for all three MnSOD-val lines after 20 cycles and visible for all lines after 25 cycles. GAPDH was used as a loading control. (c.) MnSOD protein adjusted for MnSOD mRNA. The ratios of MnSOD protein determined by western blot (Fig 2b) to MnSOD mRNA levels determined by RT-PCR (Fig. 4a) is shown for the cell lines. * Indicates significantly different from the val lines, p<0.05

