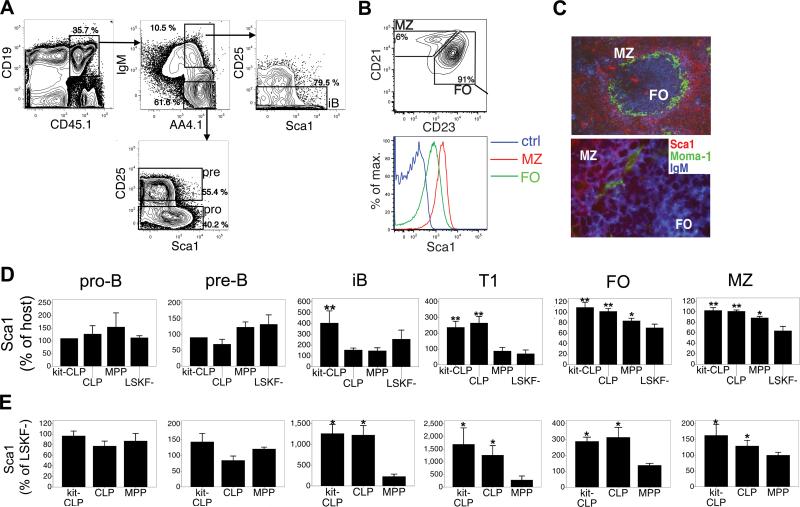
Fig. 3. Expression of Sca1.
(A) Analysis gates for donor derived pro-B, pre-B and iB cells and Sca1 expression on these fractions. Representative example of sublethally irradiated C57BL/6 mice transplanted with 3,000 MPPs. (B) Expression of Sca1 on MZ and FO B cells in C57LB/6 mice. (C) Fluorescence microscopy of the spleen after staining for Sca1, MOMA-1 (which detects matrix metallophilic macrophages that separate the follicles from the MZ) and IgM (upper 100x, lower 630x). (D) Expression of Sca1 on donor-derived B lineage cells 3 weeks after transfer of 3,000 of CLPs, kit-CLPs, MPPs, or LSKF- cells into sublethally irradiated C57BL/6 mice. Sca1 expression calculated as the ratio between the geometric mean of Sca1 fluorescence of kit-CLPs, CLPs, MPPs or LSKF- -derived cells and that of host cells of the same phenotype in each recipient. (n = 6, * significantly different from LSKF- cells, ** significantly different from MPPs and LSKF- cells). (E) Expression of Sca1 on donor-derived B lineage cells 3 weeks after transfer 1,500 CD45.1+ CLPs, kit-CLPs or MPPs together with 1,500 CD45.1+CD45.2+ LSKF- cells into sublethally irradiated Rag1-/- mice. Sca1 expression calculated as the ratio between the geometric mean of Sca1 fluorescence of kit-CLPs, CLPs, MPPs -derived cells and that of LSKF—derived cells of the same phenotype in each recipient. (n = 3; * significantly different from LSKF- cells).

